Inventory Expansion and Market Rebalancing
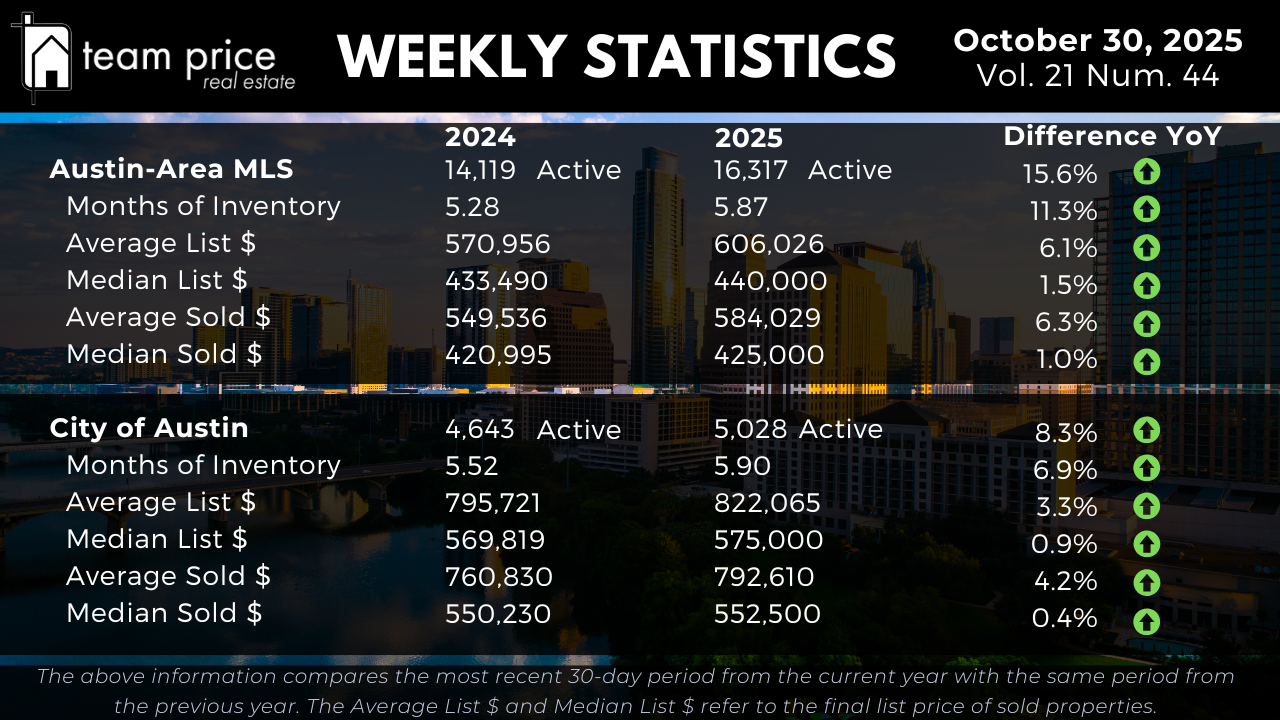
The Austin housing market continues its steady transition toward a supply-driven environment as inventory growth outpaces buyer absorption. Across the Austin-Area MLS, active residential listings have increased 15.6% year over year, climbing from 14,119 in 2024 to 16,317 in 2025. That marks a slightly stronger expansion than last week’s 14.8% increase, signaling that new listings continue to outnumber contract activity heading into late October.
Months of Inventory rose from 5.28 to 5.87, up 11.3% year over year, confirming that properties are taking longer to sell. The overall market now carries roughly 1.1 times the supply seen a year ago. Within the City of Austin, inventory is up 8.3% year over year—from 4,643 to 5,028 active listings—while Months of Inventory increased from 5.52 to 5.90, a 6.9% gain. Although these gains are more moderate inside city limits, both metrics confirm that Austin remains firmly in a buyer-advantaged phase.
Compared to last week, the market’s trajectory has not shifted meaningfully—inventory is still expanding, but absorption remains soft. This continued rise in supply underscores a durable trend rather than a short-term fluctuation. As we move deeper into the fourth quarter, the Austin-area market has fully entered a normalization phase, where buyers have more choices and sellers must rely on competitive pricing and presentation to attract offers.
Pricing Trends and Market Direction
Price movement across Central Texas remains modest but directionally stable, with top-line averages showing improvement while median values—representing the middle of the market—remain nearly flat. Across the Austin-Area MLS, the average list price rose 6.1% year over year, from $570,956 to $606,026, while the median list price increased 1.5%, from $433,490 to $440,000. These small but consistent gains reflect the continued listing of higher-end homes, which lift averages even as mid-market pricing levels off.
The average sold price climbed 6.3%, rising from $549,536 to $584,029, while the median sold price advanced 1.0%, moving from $420,995 to $425,000. Week over week, both figures show incremental progress—evidence that the market’s mild appreciation trend is persisting but concentrated primarily in upper-tier price brackets.
Inside the City of Austin, pricing changes are similarly measured. The average active price increased 3.3%, from $795,721 to $822,065, while the median list price edged up 0.9%, from $569,819 to $575,000. On the sold side, the average price rose 4.2%, from $760,830 to $792,610, and the median sold price gained 0.4%, from $550,230 to $552,500. Taken together, these figures confirm a city market that has stabilized, with gradual nominal improvement following two years of correction.
Overall, while the top end of the market continues to support headline growth, the broader landscape remains characterized by flat to modest appreciation—a sign of balance rather than renewed acceleration.
Negotiation Environment and Buyer Leverage
Negotiation data continues to reinforce the shift toward buyer control. As of late October, 69.21% of homes are selling below list price, up from 66% last month, showing an increasing willingness among sellers to meet buyer demands. 18.42% of homes are closing exactly at list price, down from 21.85%, while 12.37% are selling above asking—slightly higher than last month’s 12.15%, but still well below the levels seen during the pandemic boom.
The average sold-to-list price ratio now stands at 96.87%, meaning sellers are conceding roughly 3% on average from their asking price. This is consistent with last week’s figure and indicates continued price flexibility across nearly all segments. Properties with longer days on market or those in oversupplied submarkets are experiencing the deepest discounts, while well-priced listings are still commanding strong engagement.
In short, this is no longer a market defined by urgency—it’s one defined by precision. Sellers who price within market reality are finding success; those who overshoot are seeing extended timelines and steeper concessions.
Regional and ZIP Code Performance
The regional picture shows clear divergence across cities and ZIP codes. Of the 30 cities tracked in Central Texas, 12 (40%) recorded month-over-month price increases, while 18 (60%) experienced declines. On a year-over-year basis, 10 cities (33%) posted gains, and 19 (63%) recorded declines, with all 30 cities now below their 12-month peak values.
At the ZIP code level, the market is more evenly split. 48% (36 of 75) reported month-over-month price increases, while 52% (39 of 75) saw decreases. Year over year, 44% (33 of 75) posted gains and 56% (42 of 75) registered declines. Only one ZIP code across the region remains above its 12-month peak, confirming that the market’s normalization is both deep and widespread.
Compared with last week, the ratios of increasing versus declining markets remain nearly identical, reinforcing that Central Texas has entered a stable equilibrium phase rather than an active correction. Localized price movements continue to depend heavily on school district appeal, commute corridors, and relative affordability within each micro-market.
Prices Relative to Peak Levels
When measured against the post-pandemic highs, the Austin market has now completed its correction cycle and found a sustainable floor. Across the Austin-Area MLS, the average sold price remains 12.2% below the May 2022 peak, while the median sold price sits 20.3% lower. On a price-per-square-foot basis, averages are down roughly 21% to 24% from their respective peaks.
Within the City of Austin, the correction is comparable. The median sold price has fallen 19.1% from its May 2022 high, while the average sold price is 6.7% below peak. The average sold price per square foot is down 21%, and the median price per foot is down 25% from their respective highs. These figures underscore that the steepest portion of the correction is behind us, and the market has now stabilized near its post-surge baseline.
Market Outlook
As October closes, the Austin housing market stands on firmer footing than it did earlier in the year, even as inventory continues to rise. Active listings are expanding faster than buyer demand, but prices are holding steady—proof that the region’s fundamentals remain strong. For buyers, this is an opportunity-rich environment defined by greater selection, longer decision windows, and increasing negotiation leverage. For sellers, success depends on adaptability: accurate pricing, strong presentation, and a clear understanding of hyperlocal trends.
Compared with both last week and last year, the Austin market’s direction is clear—supply is building, pricing is stabilizing, and balance has replaced volatility. While no breakout appreciation is expected until rates ease, Austin’s steady normalization sets the stage for a healthier and more sustainable cycle in 2026.