Inventory Growth and Market Balance
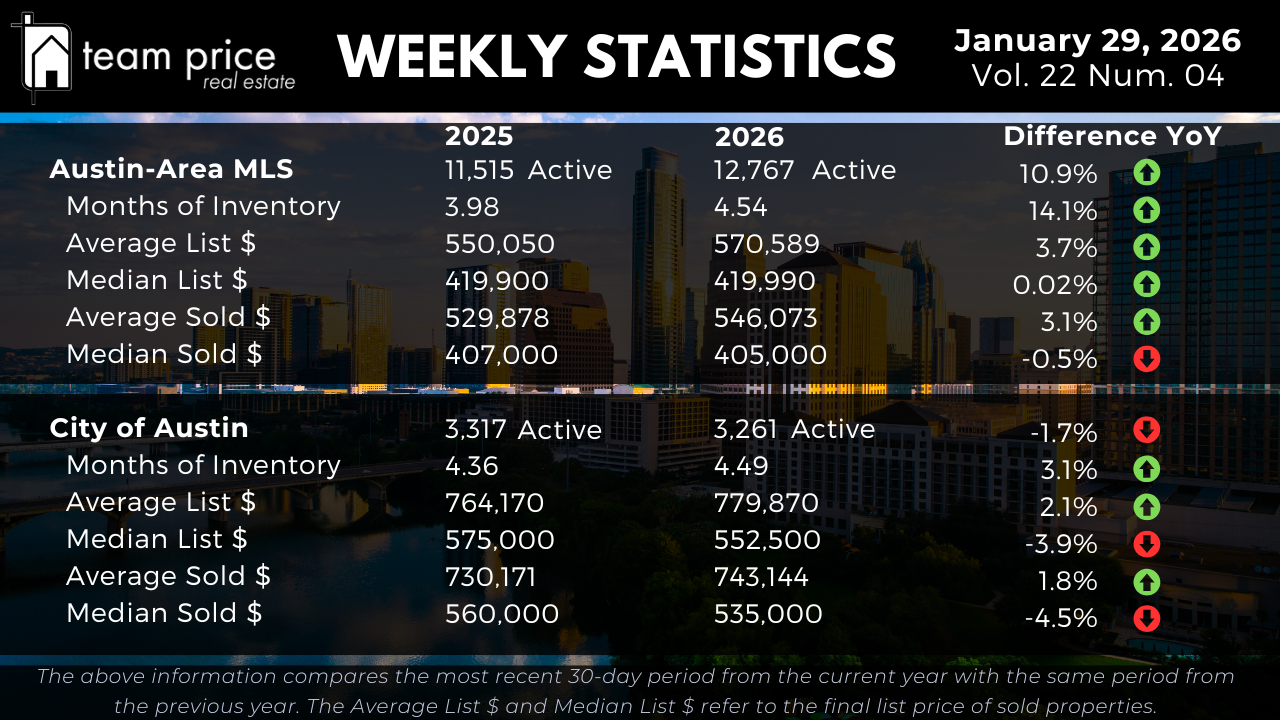
Active residential listings across the Austin-Area MLS total 12,767 this week, up from 11,515 at the same point last year, representing a 10.9% YoY increase in available supply. Inventory has continued to build week over week as new listings enter the market faster than homes are being absorbed through sales. Based on current transaction volume, Months of Inventory now stands at 4.54, up from 3.98 last year, a 14.1% YoY increase and roughly a 1.1x expansion in supply relative to demand. This places the market firmly above last year’s balance point and confirms a slower absorption environment entering the back half of January.
Inside the City of Austin, inventory trends remain more restrained but are no longer tightening. Active listings declined from 3,317 last year to 3,261 today, down 1.7% YoY, but Months of Inventory increased from 4.36 to 4.49, up 3.1% YoY. While total supply is slightly lower, homes are taking longer to sell compared to this time last year, indicating reduced sales velocity rather than true scarcity.
Pricing Stability Across the MLS
Pricing across the Austin-Area MLS continues to show separation between average and median measures. The average active list price increased from $550,050 last year to $570,589 this week, a 3.7% YoY gain, reflecting continued support at higher price points and replacement-cost inventory. In contrast, the median active list price was essentially unchanged, moving from $419,900 to $419,990, up just 0.02% YoY, signaling limited pricing power in the middle of the market.
On the sales side, the average sold price increased from $529,878 to $546,073, a 3.1% YoY gain. The median sold price declined slightly from $407,000 to $405,000, down 0.5% YoY. This divergence indicates that higher-priced transactions continue to support average pricing, while typical closings remain under mild pressure. Week over week, both median list and sold prices have shown little movement, reinforcing that pricing momentum remains limited despite seasonal activity.
Pricing Trends in the City of Austin
Within the City of Austin, pricing trends show clearer signs of adjustment. The average active list price increased from $764,170 to $779,870, a 2.1% YoY gain, while the median active list price declined from $575,000 to $552,500, down 3.9% YoY. This widening gap highlights how pricing strength remains concentrated in higher-end inventory.
On the sales side, the average sold price increased modestly from $730,171 to $743,144, up 1.8% YoY. The median sold price declined more sharply from $560,000 to $535,000, down 4.5% YoY. Week over week, median pricing within the city has continued to drift lower, indicating that price discovery is still underway, particularly for mid-range homes.
Negotiation and Buyer Leverage
Negotiation remains the dominant feature of the Austin housing market. So far this month, 71.26% of all closed sales across the Austin-Area MLS sold below list price, slightly lower than last month’s 71.45%. An additional 18.65% sold at list price, up from 18.01% last month. Only 10.09% of homes sold above list price, down from 10.53% last month and below January 2025 levels. The average sold-to-list price ratio currently stands at 96.63%, confirming that price concessions and negotiated outcomes remain common across most segments.
Regional and ZIP Code Variations
Market performance continues to vary widely across Central Texas. Of the 30 cities tracked, only 6 recorded month-over-month price increases, while 24 experienced declines. The same split holds year over year, with 6 cities posting gains and 24 posting declines. No cities are currently trading above their peak prices from the past 12 months, with all 30 remaining below recent highs.
At the ZIP code level, dispersion remains pronounced. Among the 75 ZIP codes tracked, 33 recorded month-over-month price increases while 41 declined. Year over year, 27 ZIP codes showed price increases and 48 declined. None of the tracked ZIP codes are above their peak prices from the past 12 months, with all 75 remaining below peak levels, underscoring how widespread the price reset has been.
Prices Relative to Peak Levels
Prices across the Austin-Area MLS remain materially below prior market highs. The average list price is down approximately 12.2% from its March 2023 peak, while the median list price is down about 22.2% from its May 2022 high. The average sold price is down roughly 18.6% from peak, and the median sold price is down approximately 25.7%. On a price-per-square-foot basis, both average and median sold values remain roughly 25% to 28% below their 2022 highs.
Within the City of Austin, peak-to-current declines also remain significant. The average list price is down approximately 10.0% from its September 2025 peak, while the median list price is down about 16.5% from its May 2022 high. The average sold price is down roughly 12.6% from peak, and the median sold price is down approximately 20.3%. Price-per-square-foot metrics remain 22% to 27% below peak levels, confirming that valuation adjustments remain firmly in place.
Market Outlook
As January 2026 progresses, the Austin housing market continues to operate in a slower, more measured environment. Inventory across the Austin-Area MLS remains higher than last year, Months of Inventory has expanded, and the majority of homes are still selling below list price. Average pricing remains supported by higher-end transactions, while median prices show limited momentum, particularly within the City of Austin. Market conditions continue to be defined by balance, negotiation, and price sensitivity rather than broad-based appreciation.